
100 Questions and 3,000 Answers


President Reagan was once quoted as saying if the game Trivial Pursuit were designed by economists, it would have 100 questions and 3,000 answers. President Reagan’s quip is the title of a Tidbits feature—100 Questions and 3,000 Answers. The feature highlights a question or comment from a reader along with a response. Send questions or comments to rollingeconjay@gmail.com.
Question/Comment: This edition of 100 Questions and 3,000 Answers responds to a reader’s comment regarding March’s Chart of the Month. The chart contained a map showing the decline in beef cow numbers since 2019 in major cattle producing states including Nebraska. Beef cow numbers in Nebraska have declined nearly 20% over the last seven years. The reader suggested a more accurate picture of the current situation in the beef sector would contrast the change in pounds of beef produced with the change in cow numbers.
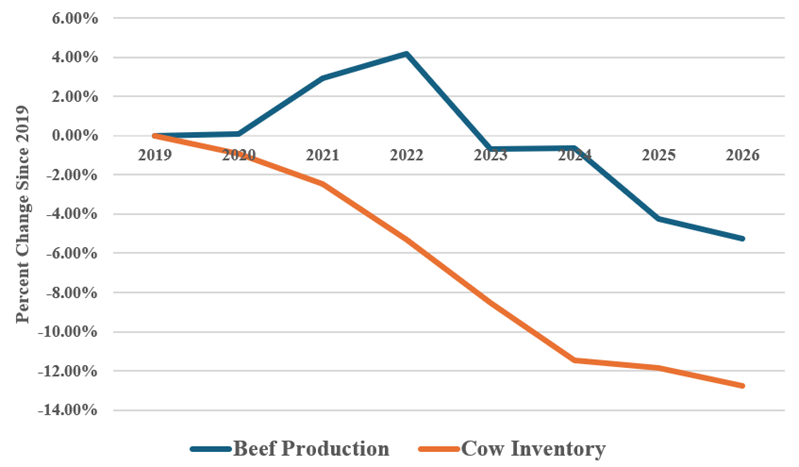
Response: Figure 2 plots the percentage changes in U.S. beef production and cow numbers since 2019. As can be easily seen, cow numbers have declined much more precipitously compared to beef production. While cow numbers decreased continuously over the period, beef production increased between 2020-2022, remained steady in 2023, then began to decline in 2024. Overall, the U.S. cow inventory declined almost 13% over the past seven years. Beef production was off just slightly more than 5%.
Figure 2. Cumulative Percent Change in U.S. Beef Production & Cow Inventory Since 2019
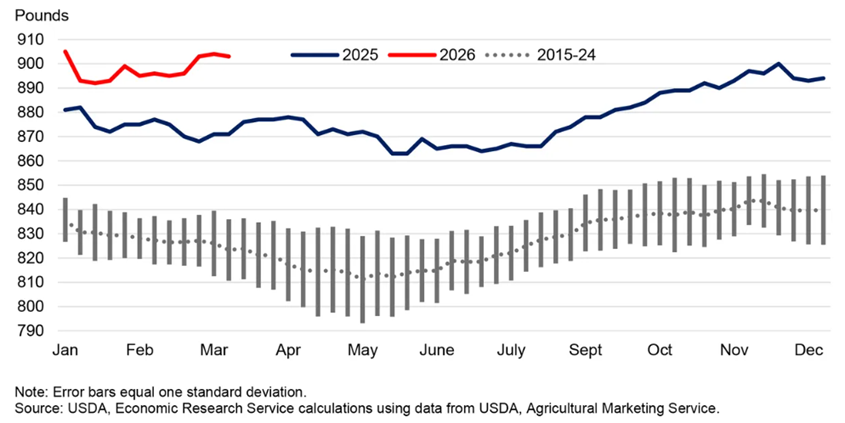
One would think trends in beef production would track trends in cow numbers. Why haven’t they? Increased carcass weights. As shown in Figure 3 from the USDA Economic Research Service, average carcass weights in March exceeded 900 pounds, an all-time high. And the average weight in late April remained above 900 pounds. The increase is not new to this year. The average weight was up 22 pounds in 2024, up 25 pounds in 2025, and up almost 32 pounds so far this year. Weights are greater because feedlots are feeding cattle longer, producing heavier cattle. The USDA says that compared to cattle on feed last year, 18% more cattle this year have been on feed longer than 150 days and 91% more have been fed longer than 180 days. Lower cattle numbers, inexpensive feed, and reduced discounts by packers for heavier weights have incentivized feedlots to feed cattle longer, the result being heavier cattle.
The reader was perceptive in calling attention to the differences in changes in beef production versus cow numbers and knowing March’s Chart of the Month didn’t tell the whole story. It’s a good reminder that relationships in economics and markets can and do change.
Figure 3. Average Carcass Weights